
Data Analysis Plan for Factorial ANOVA (GLM)
Do you have two or more independent variables or predictors called factors but measured using different participants (between groups), then independent factorial design would be the best choice and this is called as One-Way Independent ANOVA. However, if you have an experiment where several independent variables are measured among the same participants (repeated measures) then applying related factorial design would be the best choice, which is commonly called as Two-Way repeated measures ANOVA. Yet, where the experimental data where independent variables are measured mix of both same and different participants, then applying mixed factorial design is the right choice for your research. This is also called as Two-way Mixed ANOVA and when three predictors where all are measured using different participants are called as three-way independent ANOVA.
Data Analysis Plan Two Way repeated measured ANOVA
RQ1: Is there a change in criminal scores (dependent variable) for offenders across of time spent (independent variable) in prison?
Hypotheses for the above research question is as follows
- Null Hypotheses (H1o): There is no statistically significant difference in criminal score (dependent variable) across the time spent (independent variable).
- Alternate Hypotheses (H1a): There is a statistically significant difference in criminal score (dependent variable) across the time spent (independent variable).
To address the above question, you required one categorical independent variable (Time 1, Time 2, Time 3) and one continuous dependent variable (Scores on identity of criminal)
We will check for assumptions before running the inferential statistics such as normality, independence of observation, random sample, and homogeneity of variance. In this case of analysis, we specifically check for Maluchly’s test of sphericity which should be >0.05, else assumption is violated. Further descriptive statistics and multivariate tests, where Wilk’s Lambda, if p<.05, then, there is statistically significant effect for time. Further, we also check for effect size, particularly Partial Eta Squared in the Multivariate Box. According to Cohen (1988), If .01= small effect; .06=medium effect; .14=large effect. Pair wise of time point’s comparison will also be made to ensure the difference between them is significant. The result of the report is presented as follow. In order to compare criminal scores among prisoners, a one-way repeated measures analysis of variance was conducted at different time period viz., time 1, time 2 and time 3, where prior to intervention, after intervention and six months follow up respectively. Table 1 presents the means and standard deviation. There was significant effect of time, Wilk’s Lambda=0.18, F (2, 88) =402.77, p<.0004, multivariate partial squared=0.987. The findings revealed that scores of the criminals significantly increased over time.
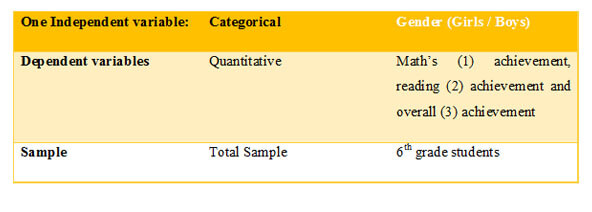
One Way Multivariate Analysis of Variance (MANOVA)
MANOVA assumes one independent variable (two or more categorical) and 2 or more dependent variables (quantitative). The research question posed for this type of analysis would be as follows:
Research Question: Does gender significantly affect math’s achievement, reading achievement and overall achievement among 10th grade students?
Hypotheses for the above research question is as follows
Null Hypotheses (H1o): There is no statistically significant difference between male and female on math’s, reading and overall achievement among 10th grade students.
Alternate Hypotheses (H1a): There is no statistically significant difference between male and female on math’s, reading and overall achievement among 10th grade students
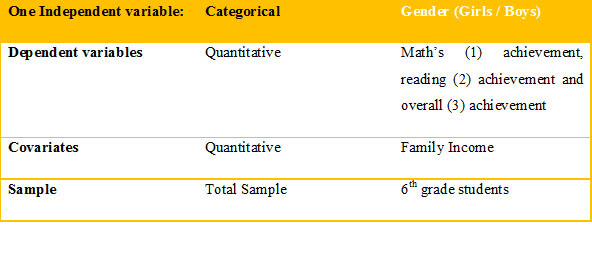
Multivariate Analysis of Covariance (MANCOVA)
MANCOVA assumes one independent variable (two or more categorical) and 2 or more dependent variables (quantitative) while at the same time controlling for covariate(s). The research question posed for this type of analysis would be as follows:
Research Question: Does gender significantly affect math’s achievement, reading achievement and overall achievement among 10th grade students after adjusting for income?
Hypotheses for the above research question is as follows
Null Hypotheses (H1o): There is no statistically significant difference between male and female on math’s, reading and overall achievement among 10th grade students after controlling for family income.
Alternate Hypotheses (H1a): There is no statistically significant difference between male and female on math’s, reading and overall achievement among 10th grade students after controlling for family income.
For both the analyses we check for sampling and data, firstly to allow for generalization of findings to larger population, samples should be drawn randomly /probability selected population. Secondly, data must be quantitative, where measurement scales should be categorical (nominal, ordinal, interval, ratio) and actual measures can be ratio or interval. We calculate Wilk’s lambda and related significance, where no treatment effect or no differences between groups, then if significant difference thenHowever, running the MANOVA is challenging task as spss and other statistical software provides several output such as Pillai’s Trace, Wilk’s Lambda, Hotelling’s Trace and Roy’s Largest Root. By leveraging the help of our consultants you can identify the right tool, identify and report only relevant output.
For more information on Data Analysis Plan for MANCOVA and MANOVA, contact our statistics consultants from Statswork